
Pydantic Logfire
Share
Pydantic Logfire
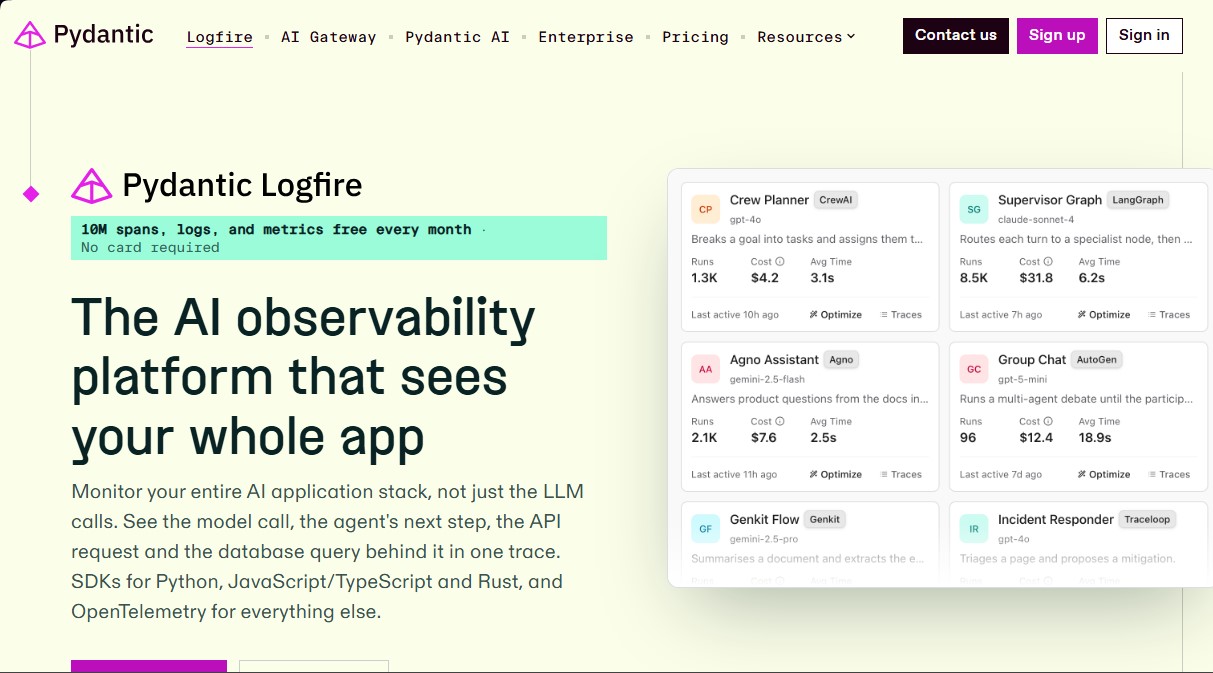
AI observability platform monitoring the entire stack, from model calls to databases, through integrated traces, logs, and metrics.
General Information about Pydantic Logfire
Pydantic Logfire is an advanced AI application observability platform designed to monitor the entire development stack, moving beyond the limitations of tools that only track Large Language Model (LLM) calls. This solution allows you to visualize the model's response alongside intermediate agent steps, API requests, and database queries in a single, coherent timeline. Its primary focus is providing complete traceability to help developers identify whether a performance issue or error originates from the prompt, a slow vector search, or a backend infrastructure failure.
Pydantic Logfire's technology is built on the OpenTelemetry standard, ensuring full interoperability and preventing vendor lock-in. It utilizes a proprietary columnar storage engine called FusionFire, based on Apache DataFusion, which enables the efficient processing of large volumes of telemetry data. One of its most powerful technical features is the ability to query traces using SQL with Postgres syntax, facilitating deep analysis of latencies, costs, and errors without the need to learn proprietary query languages.
Key functional capabilities and benefits of this tool include:
- Unified application tracing: View the complete flow of a request, correlating the frontend, backend, and external service calls on a single screen.
- Integrated Evaluations (Evals): Simplify the implementation of programmatic tests, LLM-based judges, and human reviews directly on production traces to detect regressions.
- AI agent debugging: Offers specific views to analyze agent reasoning, tool usage, and real-time token consumption.
- Security and privacy: Includes PII scrubbing features in the SDK, compliance with regulations like SOC 2 Type II and HIPAA, and European Union data residency options.
- Native integration: Directly supports popular frameworks such as FastAPI, Pydantic AI, LangChain, LlamaIndex, and the Vercel AI SDK, along with SDKs for Python, JavaScript/TypeScript, and Rust.
Pydantic Logfire is especially useful for engineering teams requiring LLM monitoring in production environments where reliability is critical. By allowing evaluations to live within the trace itself, developers can close the loop on continuous improvement, using real-world failures to generate new test datasets. It is a robust solution for optimizing p95 latency, controlling model spending, and ensuring AI systems behave predictably within the overall enterprise architecture.
Features and Use Cases of Pydantic Logfire
How Pydantic Logfire Works
Frequently Asked Questions about Pydantic Logfire
What is Pydantic Logfire and what are its benefits for AI application development?
It is an observability platform that allows you to trace an application's entire tech stack, displaying everything from model calls to database queries on a single timeline.
How much does Pydantic Logfire cost for professional projects?
The service offers a free tier of 10 million records per month. Beyond that limit, it costs $2 for every million additional records.
Which programming languages does Pydantic Logfire currently support?
The tool provides native SDKs for Python, JavaScript, TypeScript, and Rust. It is also compatible with any other language that supports the OpenTelemetry standard.
Does Pydantic Logfire allow for complex queries on telemetry data?
Yes, it features an engine called FusionFire that lets you run Postgres-like SQL queries for advanced analysis of all stored attributes and traces.
How does Pydantic Logfire differ from other solutions like LangSmith or Langfuse?
Unlike other tools that focus solely on the LLM layer, this platform provides full visibility into the entire backend, making it easy to pinpoint errors in external services or databases.
How does Pydantic Logfire handle security and the privacy of sensitive information?
The platform is SOC 2 Type II and HIPAA compliant, offers data residency in the EU, and allows you to scrub personal data directly from your code.
Can Pydantic Logfire be integrated with popular frameworks like FastAPI or Django?
Yes, the tool includes easy integrations for major Python and JavaScript frameworks, allowing you to instrument your entire application with just a few lines of code.
What kind of support does Pydantic Logfire provide for AI model evaluation?
It lets you run evaluations directly within production traces, making it easier to compare results and detect regressions before they impact end users.
Does Pydantic Logfire offer a self-hosting option for large enterprises?
Yes, the enterprise plan includes the option for self-managed deployment on the client's own infrastructure using Kubernetes containers.
How does Pydantic Logfire help optimize the performance of RAG systems?
It allows you to visualize the exact latency of every step—from vector database searches to context retrieval—helping you identify which part of the process is slowing down response times.
Pydantic Logfire Pricing
Personal (Free) - 0 $/month
10 million telemetry records per month (hard limit).
Agent, service, and host monitoring.
3 projects.
30-day data retention.
1 user and 2 read-only guests.
No credit card required.
Team - 49 $/month
10 million records included (2 € per additional million).
Unlimited agent, service, and host monitoring.
AI output evaluations and human review.
5 users included and 10 read-only guests.
Option to set a spending limit to avoid surprise bills.
Growth - 249 $/month
Includes all Team plan features.
Unlimited users, guests, and projects.
Up to 90-day data retention.
Priority support and BAA for HIPAA compliance.
Option to set a spending limit.
Enterprise - Custom pricing (Contact sales)
Observability SLOs with burn rate alerts.
Cloud, dedicated, or self-hosted deployment options.
SSO, SCIM, and custom roles.
Custom retention and support with Service Level Agreements (SLAs).
Volume discounts.
Pydantic Logfire Screenshots