
Figwise
Share
Figwise
Generate publication-ready scientific figures and PRISMA diagrams. Create AI-powered graphical abstracts and conceptual frameworks for journals.
General Information about Figwise
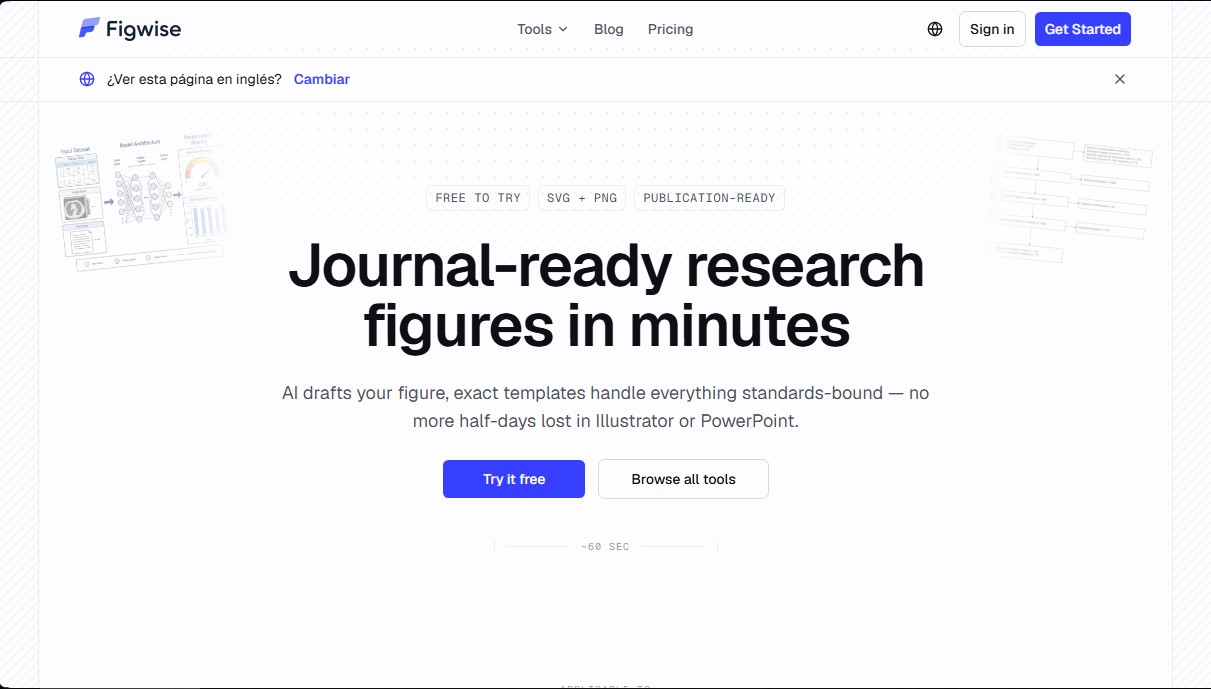
Figwise is a platform specialized in creating publication-ready scientific figures, designed to streamline the workflow for researchers, academics, and manuscript authors. This tool allows users to generate high-quality graphics in just a few minutes, eliminating the need to spend entire days using complex design software like Illustrator or PowerPoint. Its primary function is to transform text descriptions and data into visual representations that strictly adhere to the editorial standards of the most demanding scientific journals.
The application’s operation is based on an approach that combines artificial intelligence for draft design with the use of precise technical templates. The process is structured into three simple steps: the user describes their study or pastes an abstract, reviews the automatically generated draft structure, and exports the final file. Figwise technology is capable of processing natural language to classify variables and structure conceptual frameworks, ensuring that the visual hierarchy remains consistent with the research methodology presented.
The platform integrates several specific utilities to cover all stages of scientific paper preparation:
- Graphical Abstract Generator: Allows users to convert a text summary into a visual draft with preset dimensions for publishers such as Elsevier or MDPI.
- PRISMA and CONSORT Flowchart Creator: Facilitates the generation of official diagrams (PRISMA 2020 and CONSORT 2010) by simply entering screening or participant numbers, guaranteeing a professional format free of manual errors.
- Conceptual Framework Generator: Automatically classifies study variables into independent, mediating, or moderating roles based on a natural language description.
- Data Visualization Tools: Includes volcano plot generators for differential expression analysis and tools to create phylogenetic trees from species lists or Newick format.
For researchers, the practical benefit lies in obtaining SVG vector figures and high-resolution PNG files that maintain visual integrity when scaled. By using this AI research tool, authors ensure their figures meet journal formatting requirements from the very beginning, facilitating the peer-review process.
Figwise guarantees that the data and text entered are not used to train external models, maintaining research confidentiality. It is an optimized solution for systematic review authors, quantitative researchers, and PhD students who need to produce professional-grade graphic material efficiently and accurately.
Features and Use Cases of Figwise
How Figwise Works
Frequently Asked Questions about Figwise
What is Figwise and what is it used for?
It is a tool designed to create high-quality scientific figures, such as graphical abstracts and flowcharts, in just a few minutes.
Is Figwise free to use?
The PRISMA and CONSORT diagram generators are free, and new accounts receive complimentary credits to test the AI tools.
What file formats can I use to export my results?
The platform allows you to download figures in SVG vector format or as PNG images with the appropriate resolution for direct publication.
Does Figwise meet the formatting requirements of scientific journals?
Yes, the designs automatically adjust to the dimensions and guidelines of international publishers such as Elsevier or MDPI.
Are my data or abstracts used to train artificial intelligence models?
No, the information you provide is used exclusively to generate your figure and is not used to train any models.
Can I get an invoice so my university can reimburse the cost?
Yes, the system generates invoices that include your institution's tax information to facilitate the reimbursement process for credits or subscriptions.
Are diagrams editable once they have been created?
Flowcharts are fully editable by changing the input data, and SVG files can be modified using professional design software.
Figwise Pricing
Free Plan (Free to try)
Price: 0 $.
Free access to PRISMA and CONSORT diagram generators and graphing tools, no registration required.
Free trial of AI tools: 85 credits upon account creation (enough for approximately 2 figures).
Starter Plan
Price: 15 $/mo (or 12 $/mo billed annually).
1,700 monthly credits (or 20,400 credits per year with the annual plan).
Estimated limit of 57 AI-generated figures per month.
Access to all models and styles.
Commercial use license.
Permanent figure library.
Automatic credit refunds for failed generations.
Credits reset at the start of each monthly cycle.
Pro Plan
Price: 29 $/mo (or 23 $/mo billed annually).
4,200 monthly credits (or 50,400 credits per year with the annual plan).
Estimated limit of 140 AI-generated figures per month.
Access to all models and styles.
Commercial use license.
Permanent figure library.
Automatic credit refunds for failed generations.
Credits reset at the start of each monthly cycle.
Max Plan
Price: 59 $/mo (or 45 $/mo billed annually).
10,500 monthly credits (or 126,000 credits per year with the annual plan).
Estimated limit of 350 AI-generated figures per month.
Access to all models and styles.
Commercial use license.
Permanent figure library.
Automatic credit refunds for failed generations.
Credits reset at the start of each monthly cycle.
Credit Packs (One-time purchase)
Small Pack: 12 $ for 1,000 credits (approx. 33 figures).
Medium Pack: 20 $ for 2,200 credits (approx. 73 figures).
Large Pack: 50 $ for 5,500 credits (approx. 183 figures).
Figwise Screenshots